Binding Multiple IP Addresses on the Same Network Interface
Binding Multiple IP Addresses on the Same Network Interface
Add new address
sudo ifconfig en1 alias 192.168.2.2 netmask 255.255.255.0
sudo ifconfig en1 alias 192.168.3.3 netmask 255.255.255.0
sudo ifconfig en1 alias 192.168.4.4 netmask 255.255.255.0
sudo ifconfig lo0 alias 127.0.0.2
Remove alias address
sudo ifconfig en1 remove 192.168.2.2 netmask 255.255.255.0
sudo ifconfig en1 192.168.3.3 netmask 255.255.255.0 delete
sudo ifconfig en1 192.168.4.4 netmask 255.255.255.0 -alias
sudo ifconfig lo0 -alias 127.0.0.2
Installing Logster on CentOS
Installing Logster on CentOS
Install EPEL repository
sudo rpm -Uvh http://dl.fedoraproject.org/pub/epel/6/x86_64/epel-release-6-6.noarch.rpm
yum update # This takes quite a while for a fresh install
Setting locale
cat >> ~/.bash_profile
Install Dependence
yum -y install logcheck
logcheck dependencies:
- liblockfile
- lockfile-progs
- perl-IPC-Signal
- perl-Proc-WaitStat
- perl-mime-construct
Install logster
git clone git://github.com/etsy/logster.git
cd logster
make install
dry run
/usr/sbin/logster --output=stdout SampleLogster /var/log/httpd/access_log
Add crontab
crontab -e
* * * * * /usr/sbin/logster -p blog_4aiur_net --output=graphite --graphite-host=localhost:2003 SampleLogster /var/log/httpd/blog.4aiur.net_access_log >/dev/null 2>&1
Installing and Configuring Graphite on CentOS
Installing and Configuring Graphite on CentOS
Install EPEL repository
sudo rpm -Uvh http://dl.fedoraproject.org/pub/epel/6/x86_64/epel-release-6-8.noarch.rpm
sudo yum -y update # This takes quite a while for a fresh install
Alternatively:
wget -r -l1 --no-parent -A "epel*.rpm" http://dl.fedoraproject.org/pub/epel/6/x86_64/
sudo yum -y --nogpgcheck localinstall */pub/epel/6/x86_64/epel-*.rpm
Install Dependences
sudo yum -y install gcc.x86_64 git.x86_64 python-devel pyOpenSSL \
    python-memcached bitmap bitmap-fonts python-crypto zope pycairo \
    mod_python python-ldap Django django-tagging python-sqlite2
Install Python package management software
sudo yum -y install python-pip.noarch
Install Graphite
-
carbon
a Twisted daemon that listens for time-series data
-
whisper
a simple database library for storing time-series data (similar in design to RRD)
-
graphite-web
a Django webapp that renders graphs on-demand using Cairo
sudo pip-python install whisper carbon graphite-web
Configure graphite
cd /opt/graphite/conf
sudo rename .conf.example .conf *
cd /opt/graphite/webapp/graphite
sudo python manage.py syncdb
sudo chown -R apache:apache /opt/graphite/storage/
Start the data collection daemon carbon-cache
cd /opt/graphite/bin
sudo ./carbon-cache.py start
Configure Apache VirtualHost
edit /etc/httpd/conf/httpd.conf
    ServerName graphite.4aiur.net
    DocumentRoot "/opt/graphite/webapp"
    CustomLog /var/log/httpd/graphite.4aiur.net_access_log combined


        SetHandler python-program
        PythonPath "['/opt/graphite/webapp'] + ['/usr/lib/python/site-packages/'] + sys.path"
        PythonHandler django.core.handlers.modpython
        SetEnv DJANGO_SETTINGS_MODULE graphite.settings
        PythonDebug Off
        PythonAutoReload Off

        SetHandler None

        SetHandler None

    alias /media/ /usr/lib/python2.6/site-packages/django/contrib/admin/media/
Test insert data to graphite
run test
python /opt/graphite/examples/example-client.py
example-client.py source code
#!/usr/bin/python
"""Copyright 2008 Orbitz WorldWide

Licensed under the Apache License, Version 2.0 (the "License");
you may not use this file except in compliance with the License.
You may obtain a copy of the License at

   http://www.apache.org/licenses/LICENSE-2.0

Unless required by applicable law or agreed to in writing, software
distributed under the License is distributed on an "AS IS" BASIS,
WITHOUT WARRANTIES OR CONDITIONS OF ANY KIND, either express or implied.
See the License for the specific language governing permissions and
limitations under the License."""

import sys
import time
import os
import platform
import subprocess
from socket import socket

CARBON_SERVER = '127.0.0.1'
CARBON_PORT = 2003

delay = 60
if len(sys.argv) > 1:
  delay = int( sys.argv[1] )

def get_loadavg():
  # For more details, "man proc" and "man uptime"
  if platform.system() == "Linux":
    return open('/proc/loadavg').read().strip().split()[:3]
  else:
    command = "uptime"
    process = subprocess.Popen(command, stdout=subprocess.PIPE, shell=True)
    os.waitpid(process.pid, 0)
    output = process.stdout.read().replace(',', ' ').strip().split()
    length = len(output)
    return output[length - 3:length]

sock = socket()
try:
  sock.connect( (CARBON_SERVER,CARBON_PORT) )
except:
  print "Couldn't connect to %(server)s on port %(port)d, is carbon-agent.py running?" % { 'server':CARBON_SERVER, 'port':CARBON_PORT }
  sys.exit(1)

while True:
  now = int( time.time() )
  lines = []
  #We're gonna report all three loadavg values
  loadavg = get_loadavg()
  lines.append("system.loadavg_1min %s %d" % (loadavg[0],now))
  lines.append("system.loadavg_5min %s %d" % (loadavg[1],now))
  lines.append("system.loadavg_15min %s %d" % (loadavg[2],now))
  message = '\n'.join(lines) + '\n' #all lines must end in a newline
  print "sending message\n"
  print '-' * 80
  print message
  print
  sock.sendall(message)
  time.sleep(delay)
View graphite data
sudo iptables -I INPUT -p tcp --dport 80 -j ACCEPT
sudo service httpd restart
goto your graphite site
Delete graphite data
cd /opt/graphite/storage/whisper
rm your_data.wsp
Some wonderful Graphite dashboards
- http://grafana.org/
- https://github.com/urbanairship/tessera
- https://github.com/ripienaar/gdash
- https://github.com/Dieterbe/graph-explorer
- https://github.com/obfuscurity/descartes
- https://github.com/obfuscurity/tasseo
- http://kenhub.github.com/giraffe
- http://jondot.github.com/graphene/
- http://square.github.com/cubism/
JMX monitoring
JMX monitoring
dataflow
java app -> jmxagent ->
                         jmxtrans -> jmx_output.log -> alert.sh -> send mail
java app -> jmxagent ->
Configuration jmx agent with authentication
JMX dynamically allocated random port, and it will bind the port at internal address.
If you connecting jmx through firewall or your servers on Amazon EC2,
maybe can’t connect to the jmx agent, So need to do some prepare.
add jmx agent parameter in your java startup script
cmd[0]='curl -s http://ifconfig.me/ip 2>/dev/null | tr -d "\n"'
cmd[1]='curl -s http://sputnick-area.net/ip 2>/dev/null'
for ((x=0; x
configuration jmx authentication
cat > /opt/app/conf/jmxremote.access /opt/app/conf/jmxremote.password
build JMXAgent.class to jmx-agent.jar
package example.rmi.agent;

import java.io.IOException;
import java.lang.management.ManagementFactory;
import java.net.InetAddress;
import java.net.UnknownHostException;
import java.rmi.registry.LocateRegistry;
import java.util.HashMap;

import javax.management.MBeanServer;
import javax.management.remote.JMXConnectorServer;
import javax.management.remote.JMXConnectorServerFactory;
import javax.management.remote.JMXServiceURL;

/**
 * This class is used for the resolve the
 * "Connecting Through Firewall Using JMX" issue.
 *
 * http://blogs.oracle.com/jmxetc/entry/connecting_through_firewall_using_jmx
 *
 * @author root
 *
 */
public class JMXAgent {

    private static int _rmiRegistryPort=3000;

    public static void premain(String agentArgs) throws IOException {

        // Ensure cryptographically strong random number generator used
        // to choose the object number - see java.rmi.server.ObjID
        //
        System.setProperty("java.rmi.server.randomIDs", "true");

        // Start an RMI registry on port specified by example.rmi.agent.port
        // (default 3000).
        //
        final int port = Integer.parseInt(System.getProperty(
                "yottaa.rmi.agent.port", String.valueOf(_rmiRegistryPort)));

        System.out.println("Create RMI registry on port " + port);
        LocateRegistry.createRegistry(port);

        // Retrieve the PlatformMBeanServer.
        //
        System.out.println("Get the platform's MBean server");
        MBeanServer mbs = ManagementFactory.getPlatformMBeanServer();

        // Environment map.
        //
        System.out.println("Initialize the environment map");
        HashMap env = new HashMap();

        // This where we would enable security - left out of this
        // for the sake of the example....
        //

        // Create an RMI connector server.
        //
        // As specified in the JMXServiceURL the RMIServer stub will be
        // registered in the RMI registry running in the local host on
        // port 3000 with the name "jmxrmi". This is the same name the
        // out-of-the-box management agent uses to register the RMIServer
        // stub too.
        //
        // The port specified in "service:jmx:rmi://"+hostname+":"+port
        // is the second port, where RMI connection objects will be exported.
        // Here we use the same port as that we choose for the RMI registry.
        // The port for the RMI registry is specified in the second part
        // of the URL, in "rmi://"+hostname+":"+port
        //
        System.out.println("Create an RMI connector server");
        final String hostname = InetAddress.getLocalHost().getHostName();
        JMXServiceURL url = new JMXServiceURL("service:jmx:rmi://" + hostname
                + ":" + port + "/jndi/rmi://" + hostname + ":" + port
                + "/jmxrmi");

        // Now create the server from the JMXServiceURL
        //
        JMXConnectorServer cs = JMXConnectorServerFactory.newJMXConnectorServer(url, env, mbs);

        // Start the RMI connector server.
        //
        System.out.println("Start the RMI connector server on port " + port);
        cs.start();
    }

}
Install jmxtrans on your alert server
rpm -Uvh http://jmxtrans.googlecode.com/files/jmxtrans-250-0.noarch.rpm
ln -s /usr/java/jdk1.6.0_27/bin/jps /usr/bin/jps
Configuration jmxtrans
cat > /var/lib/jmxtrans/monitoring.json
Running Jmx Transformer
service jmxtrans start
# or run jmxtrans manually
cd /usr/share/jmxtrans/
/usr/share/jmxtrans/jmxtrans.sh start /var/lib/jmxtrans/monitoring.json
/usr/share/jmxtrans/jmxtrans.sh stop /var/lib/jmxtrans/monitoring.json
View jmxtrans log
cd /var/log/jmxtrans
tailf jmxtrans.log
Alert script thresholds config
cat > thresholds.conf
Alert script
cat > /opt/alert.sh /dev/null | head -${max_line} | \
    awk -v Now=$now -v Expire=$expire '
BEGIN{
    # configuration
    # #parttern expression value
    # HeapMemoryUsage_used Maximum 2500000000
    # HeapMemoryUsage_committed Minimum 6000000000
    while (getline = Values[Parttern]) {
                    return Hit=1
                }
            } else if (Expressions[Parttern] == "Minimum") {
                if (Value = Now) {
            scanner(Attr, Value)
            if (Hit == 1) {
                print
                exit
            }
        } else {
            exit
        }
    }
}
')

if [[ ! -z $message ]]; then
    send_mail "$message"
fi
logger "done."
EOF
chmod +x /opt/alert.sh
Add script into crontab
crontab -l > tmp.cron
echo "* * * * * /opt/alert.sh >> /var/log/jmxtrans/alert.log 2>&1" >> tmp.cron
crontab tmp.cron
rm -f tmp.cron
References
Suppressing paramiko log
Suppressing paramiko log
Backup paramiko source file.
cd /usr/local/lib/python2.7/site-packages/
cp -p paramiko/util.py{,.bak}
Modify paramiko/util.py.
diff paramiko/util.py{,.bak}

265c265
         return True
Set logger name "suppress" in your code.
self.client = SSHClient()
self.client.set_log_channel('suppress')
Zenoss Core setup guide
Zenoss Core setup guide
Zenoss Core is a powerful monitoring system, and it is a OpenSource software.
Install Zenoss Core
Install ZenPacks
Setup snmp and snmpd config
Add user command
Add a single device
Add custom Device Class
Custom new class properties
Setup Processes
Custom Zenoss reports
Install Zenoss Core
Before you install:
1) Run the Yellowdog Updater, Modified (YUM), which you will use to install Zenoss. To run YUM, enter this command:
# yum -y install mysql-server.x86_64 mysql-devel.x86_64 net-snmp.x86_64 \
        net-snmp-utils.x86_64 gmp.x86_64 libgomp.x86_64 libgcj.x86_64 \
        liberation-fonts.noarch sysstat.x86_64 fping.x86_64
2) Download the Zenoss installation files.
# mkdir /opt/package
# cd /opt/package
# wget "http://downloads.sourceforge.net/project/zenoss/zenoss-3.2/zenoss-3.2.0/zenoss-3.2.0.el5.x86_64.rpm"
3) If you have just installed MySQL, then use the following command to add MySQL into the startup sequence:
# /sbin/chkconfig --add mysqld
4) Enter the following command to display current run levels:
# /sbin/chkconfig --list mysqld
5) If the system responds with something similar to:
mysqld 0:off 1:off 2:off 3:off 4:off 5:off 6:off
then enter the following command to adjust run levels:
# /sbin/chkconfig --level 2345 mysqld on
6) Restart MySQL and set the password.
Note:
Do not add a space between the single quotes in the following commands.
# /etc/init.d/mysqld restart
# /usr/bin/mysql_secure_installation
# /usr/bin/mysqladmin -u root password ''
# /usr/bin/mysqladmin -u root -h localhost password ''
Note:
Initially, the MySQL password must be blank so that Zenoss can correctly create the database. After you have installed and started Zenoss, you can change this password.
Install the Software
Follow these steps to install Zenoss for Red Hat Enterprise Linux 5 or CentOS 5.
1) Enter one of the following commands to install the Zenoss RPM.
# rpm -ivh zenoss-3.2.0.el5.x86_64.rpm
2) If MySQL is running on a different server, or has a different root user password, edit the /opt/zenoss/bin/ zenoss_init_pre file and adjust the MYSQLHOST, MYSQLROOTUSER, and MYSQLROOTPASSWD values.
3) Enter this command to start Zenoss.
# service zenoss start
Note:
This step may take several minutes.
Install ZenPacks
- Go to http://community.zenoss.org/community/zenpacks
- Download Zenoss 3.0 Compatible ZenPacks
like these:- HTTP Monitor
- DNS Monitor
- fping
- Jabber/XMPP Bot
- Zen JMX Collector
- Go to http://yourhost:8080/zport/dmd/editSettings
- Click ZenPacks
- Install ZenPack(choose egg file)
Setup snmp and snmpd config
add snmp.conf to zenoss server /etc/snmp/snmp.conf.
snmp.conf example:
defversion 3
defsecurityname yourname
defsecuritylevel authNoPriv
defauthtype MD5
defauthpassphrase yourpassword
add snmpd.conf to client /etc/snmp/snmpd.conf.
snmpd.conf example:
createUser yourname MD5 "yourlonglonglonglongpassword" DES
rouser yourname auth -V yourview

#                     sec.model    sec.name
group monitorGroup    usm         yourname

#       name          incl/excl    subtree         mask(optional)
view    yourview    included     .1.3.6.1.2.1
view    yourview    included     .1.3.6.1.4.1

#       group         context sec.model sec.level prefix read       write  notif
access  monitorGroup  ""      any       auth      exact  yourview none none

syslocation Undefined
syscontact NOC

# "Pass-through" MIB extension command
pass .1.3.6.1.4.1.2021.255 /usr/share/doc/net-snmp-5.3.2.2/passtest
Add user command for debug snmp setting
- Go to http://yourhost:8080/zport/dmd/dataRootManage
- Click "Add User Command"
- Input value
Name: snmpwalkV3
Description: snmpwalk using version 3
Command: snmpwalk -${device/zSnmpVer} -l authNoPriv -u ${device/zSnmpSecurityName} -A ${device/zSnmpAuthPassword} -a ${device/zSnmpAuthType} ${here/manageIp} system
Add a single device
- Go to http://yourhost:8080/zport/dmd/itinfrastructure
- Click "Add a Single Device"
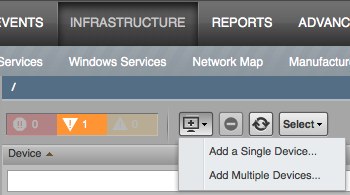
- Input items
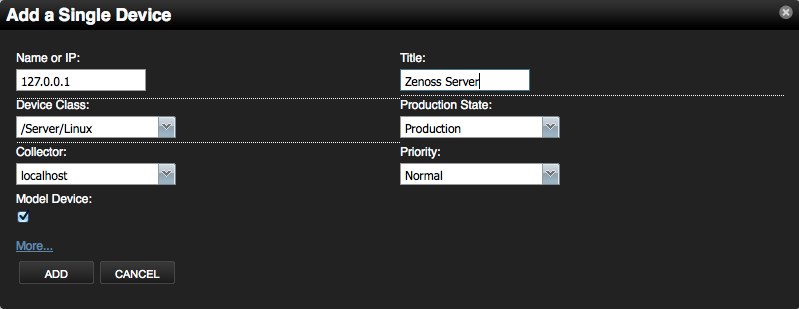
- Click "Zenoss Server", and Click left "Configuration Properties" to edit the server’s properties
- zSnmpVer: v3
- zSnmpSecurityName: yourname
- zSnmpAuthPassword: yourlonglonglonglongpassword
- zSnmpAuthType: MD5
- Click "Commands –> snmpwalkV3" verify server and client snmp configuration
- Click "Actions –> Model Device"
Add custom Device Class
Custom new class properties
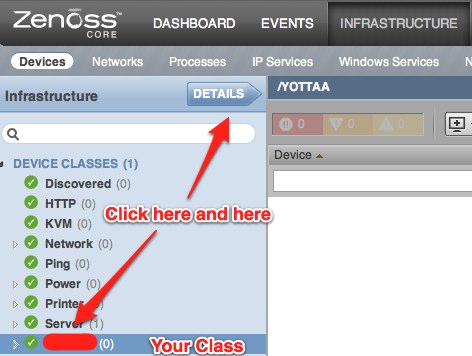
using zenoss portal
- go to the URL http://yourhost:8080/zport/dmd/itinfrastructure, click Your class name and click DETAILS
-
Configuration Custom Properties
- Modeler Plugins
- Configuration Properties
- Click "Actions" –> "Bind Templates"
using zenoss manage and zendmd
1) Login to Zenoss as "admin" and go to the URL http://yourhost:8080/zport/dmd/Devices/manage
2) Click left "your new class name", and click top "Properties"
3) To add a new property, enter a name, type and value for the new property and click the "Add" button.
Name: zCollectorPlugins
Type: lines
Value:
- zenoss.snmp.NewDeviceMap
- zenoss.snmp.DeviceMap
- zenoss.snmp.InterfaceMap
- zenoss.snmp.RouteMap
- zenoss.snmp.IpServiceMap
- zenoss.snmp.HRFileSystemMap
- zenoss.snmp.HRSWInstalledMap
- zenoss.snmp.HRSWRunMap
- zenoss.snmp.CpuMap
Name: zDeviceTemplates
Type: lines
Value:
- b_fping
- Device
- FileSystem
Name: zIcon
Type: string
Value: /zport/dmd/img/icons/server.png
Name: zSnmpAuthType
Type: string
Value: MD5
Name: zSnmpVer
Type: string
Value: v3
4) Login zendmd, change default snmp auth password
# su - zenoss
$ zendmd
>>> dmd.Devices.yourclassname.zSnmpAuthPassword = 'yourlonglonglonglongpassword'
>>> commit()
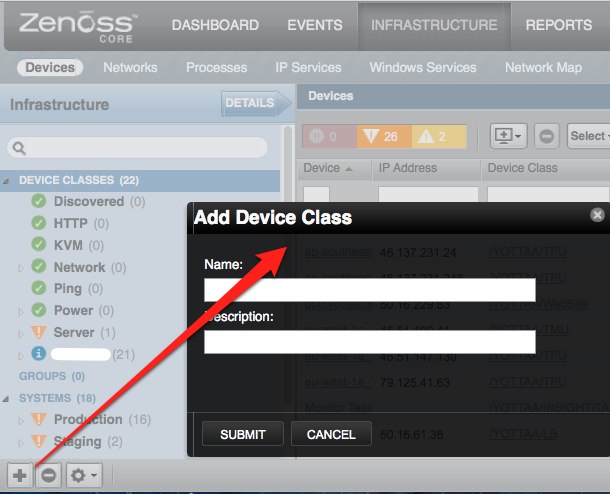
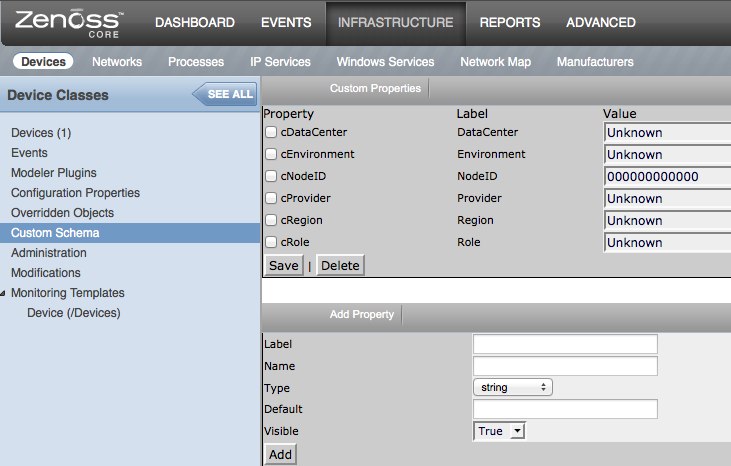
Add Custom Schema
- Go to http://yourhost:8080/zport/dmd/itinfrastructure
- Click "DEVICE CLASSES", and click "DETAILS"
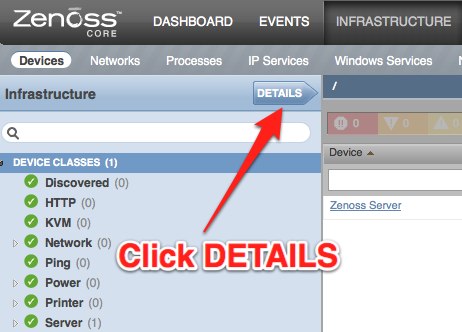
- Click "Custom Schema"
Add custom properties
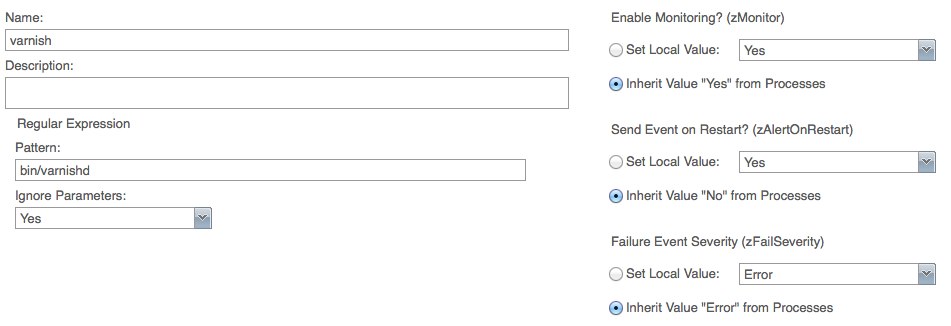
Setup Processes
- Goto http://yourhost:8080/zport/dmd/process
- Input your monitoring name
- Input Pattern, for example: /bin/varnish
Zenoss API
Zenoss have jsonapi and xmlrpc interface, you can using it’s API to integrate your management system.
jsonapi code demo:
def add_device(self, deviceName, deviceClass, title,
                productionState=1000, model=False):
    data = dict(deviceName=deviceName, deviceClass=deviceClass,
                title=title, productionState=productionState, model=model)
    return self._router_request('DeviceRouter', 'addDevice', [data])
xmlrpc code demo:
def add_device(self, deviceName, devicePath, tag):
    url = 'http://%s:%s@%s/zport/dmd/DeviceLoader' % (self.username,
            self.password, self.zenoss_host)
    serv = ServerProxy(url)
    serv.loadDevice(deviceName, devicePath, tag)
Custom Zenoss Reports
Column syntax
buildin command:
getId
python command:
python:str(dev.getRRDValue('ProcessInfo_FileDescriptor')).split('.')[0]
custom python script:
getMemUtil
Goto http://yourhost:8080/zport/dmd/Devices/manage first.
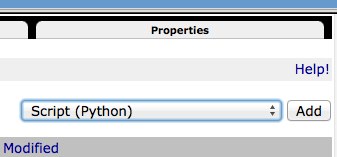
Input script name getMemUtil(), and input content like this:
total_memory = context.hw.totalMemory
mem_avail_real = context.getRRDValue('memAvailReal_memAvailReal')
mem_cached = context.getRRDValue('memCached_memCached')
if total_memory and mem_avail_real and mem_cached:
    print '%.2f%%' % ((total_memory - (mem_avail_real + mem_cached) * 1024) / total_memory * 100)
else:
    print('Unknown')
return printed
Send report email
cat  $ZENHOME/scripts/emailSummaryDailyReport.sh
#!/bin/sh
REPORTS_URL="http://yourhost:8080/zport/dmd/Reports/Graph%20Reports/Production/Production%20Summary%20Report/viewGraphReportClean/zport/RenderServer/render?width=500&drange=864000"
$ZENHOME/bin/reportmail \
--user=username \
--passwd= yourlonglonglonglongpassword \
--from="noc@foo.com" \
--address="noc@foo.com" \
--address="ops@bar.com" \
--subject="Zenoss: System Summary Daily Report" \
--url="$REPORTS_URL"
EOF
Add it into crontab
0 20 * * * /opt/zenoss/scripts/emailSummaryDailyReport.sh 2>&1 >/dev/null
References:
CentOS安装与使用ipmitool
CentOS安装与使用ipmitool
ipmitoool可以方便的查看设备硬件状态,建议设备在安装好系统后安装一下ipmitool
安装方法:
安装程序包
yum -y install OpenIPMI.x86_64 OpenIPMI-tools.x86_64 OpenIPMI-libs.x86_64 ipmitool.x86_64
添加ipmi module
modprobe ipmi_si
modprobe ipmi_devintf
modprobe ipmi_msghandler
查看module是否成功添加
lsmod | grep -i ipmi
ipmi_si                77900  0
ipmi_devintf           44688  0
ipmi_msghandler        73176  2 ipmi_si,ipmi_devintf
查看系统事件日志命令
ipmitool -I open sel list
   1 | 09/02/2010 | 04:10:26 | OEM #0x02 |
   2 | 09/02/2010 | 04:10:29 | OEM #0x02 |
   3 | 03/23/2011 | 16:02:59 | OEM #0x02 |
   4 | 03/23/2011 | 16:03:02 | OEM #0x02 |
清理系统事件日志命令
ipmitool -I open sel clear
手动升级wordpress的方法
手动升级wordpress的方法
进入到wordpress的后台管理发现有新版本更新时,使用系统自带的自动更新,总是出现300秒超时导致升级失败。
Downloading update from http://wordpress.org/wordpress-3.1.1.zip…
Download failed.: Operation timed out after 300 seconds with 1340586 bytes received
Installation Failed
使用terminal登陆到系统使用wget测试下载速度,发现服务器下载wordpress包的速度其慢无比,每秒只有3KB左右的速度。
# wget http://wordpress.org/wordpress-3.1.1.zip
--2011-04-06 15:01:31--  http://wordpress.org/wordpress-3.1.1.zip
Resolving wordpress.org... 72.233.56.138, 72.233.56.139
Connecting to wordpress.org|72.233.56.138|:80... connected.
HTTP request sent, awaiting response... 200 OK
Length: unspecified [application/zip]
Saving to: `wordpress-3.1.1.zip'
    [                                        ] 17,114      3.70K/s
解决方法:
首先进入webserver的跟目录,然后手工下载wordpress的安装包,之后修改/etc/hosts的内容把wordpress.org的地址指到本地。
# wget http://wordpress.org/wordpress-3.1.1.zip
# vi /etc/hosts
127.0.0.1 wordpress.org
之后再使用wordpress的自动升级,就可以成功了^_^。
Downloading update from http://wordpress.org/wordpress-3.1.1.zip…
Unpacking the update…
Verifying the unpacked files…
Installing the latest version…
Upgrading database…
WordPress updated successfully
Go to Dashboard
升级成功后再把/etc/hosts再修改回来。
Cacti配置流程
Cacti配置流程
Cacti是一个简单直观的监控工具,后台使用rrdtool记录监控数据,虽然功能较少,但是图形显示效果比较好看、直观、配置也比较方便,当需要有复杂的监控需求时,可以使用zabbix或者nagios来做。
这里主要讲的是Cacti两方面的配置,一个是添加设备,另外一个是配置权限
-
添加监控设备
-
首先需要在被监控的设备上安装与配置snmp agent,Linux平台请参考Linux安装与配置Snmpd,OpenSolaris参考OpenSolaris net-snmp install script,windows安装配置snmp agent方法
检查是否存在SNMP Service,需要将此服务启动。我的电脑-管理-服务-SNMP Ssrvice.
单击属性-安全,添加发送身份验证陷阱。添加在cacti中的SNMP Community,在下面添加监控端的IP地址
如果没有此服务,通过控制面板-添加组件-管理和监视工具-简单网络管理协议。 -
添加设备
登陆Cacti后点击面板左侧的devices后点击右侧面板的Add,之后填写Description, Hostname, Host Template(Linux与Solaris使用ucd/net SNMP Host,Windows使用windows2000/xp Host), 其他部分可以使用自己的值来填写"SNMP Community"或者保持不变。配置完成后点击Create增加此设备。
在创建完毕后出现的页面中点下Query Verbose 来测试下snmp数据抓取是否正常。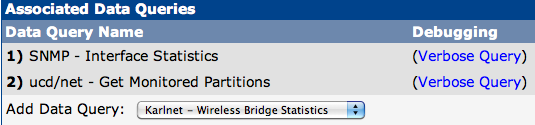
-
添加图像
点击页面中的"Create Graphs for this Host"
选中所有复选框后点击"Create",完成生成图像的设置 -
设置图像数
点击面板左侧的"Graph Trees" –> "Add",输入name后"Create" –> "Save" -
把设备添加到心的图像树中
在"Devices"中选中刚加入的设备选择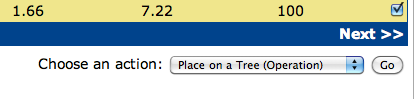
"Place on a Tree" –> "Go" –> "Continue",到这里设备的配置已经完成,可以点击导航栏的graphs查看新增加设备的各种监控图像,下面是我Cacti监控数据的两个截图
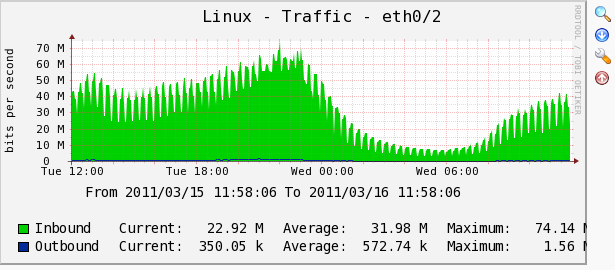
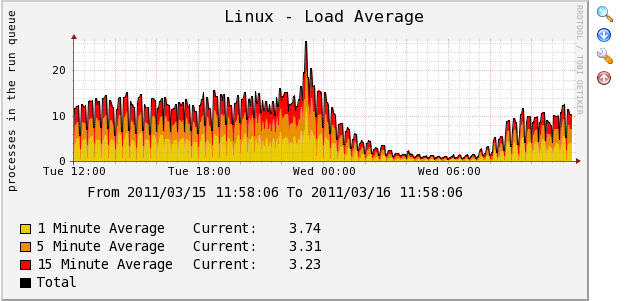
-
-
权限配置
- 增加新用户
"User Management" –> "Add",填写相应项"User Name", "Full Name", "Password", "Enabled Determines if user is able to login."这里选中"Enabled"
权限规则"Realm Permissions"处选中"View Graphs", "Export Data"即可
点击"Create"后进行图像的权限设置。
- 权限设置
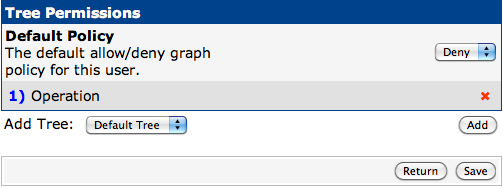
Tree Permissions中"Default Policy"使用"Deny",并增加新增的图像树如下图,之后"Save"
把"Graph Permissions (By Graph)", "Graph Permissions (By Device)", "Graph Permissions (By Graph Template)"后面的"Policy"修改为"Allow",之后"Save"。
到这里Cacti的配置已经完成"Logout"后使用新加的用户登陆即可查看设备的监控信息。
- 增加新用户
Linux安装与配置Snmpd
Linux安装与配置Snmpd
下面是两个主流的Linux,CentOS与Ubuntu的snmpd安装与自动配置脚本
Script on CentOS
#!/usr/bin/bash
# Install snmp and agent
yum install -y net-snmp net-snmp-utils

# Backup snmpd.conf
mv /etc/snmp/snmpd.conf /etc/snmp/snmpd.conf-date +%Y%m%d%H%M%S

# Write new snmpd config
cat > /etc/snmp/snmpd.conf  (configure /etc/snmp/snmp.local.conf)
disk / 20%
EOF

chkconfig snmpd on
/etc/init.d/snmpd restart
Script on Unbuntu
#!/usr/bin/bash
# Install snmp and agent
apt-get -y install snmpd snmp

# Modify snmpd listening ipaddress
sed -i 's/127.0.0.1/0.0.0.0/g' /etc/default/snmpd

# Backup snmpd.conf
mv /etc/snmp/snmpd.conf /etc/snmp/snmpd.conf-date +%Y%m%d%H%M%S

# Write new snmpd config
cat > /etc/snmp/snmpd.conf  (configure /etc/snmp/snmp.local.conf)
disk / 20%
EOF
/etc/init.d/snmpd restart